As Bitcoin Remains in Bear Territory This Crypto is About to Rocket to Fresh Highs

As Bitcoin Remains in Bear Territory, This Crypto is About to Rocket to Fresh Highs

            March 3, 2020

It has been a rocky past few weeks for the cryptocurrency markets, with Bitcoin plummeting from recent highs of $10,500 to lows of $8,400, leading most major cryptos to similarly see some intense bearishness.

There is one crypto that has been able to rally in the face of this market-wide selling pressure, however, with Chainlink setting fresh all-time highs against its Bitcoin trading pair.

This massive uptrend has led one top analyst to note that LINK’s strength against its BTC trading pair is likely to lead it significantly higher against USD in the days and weeks ahead.

Bitcoin Remains Stuck Beneath $9,000 as Analysts Eye Further Downside

After incurring a fleeting surge up to highs of $8,950 earlier this morning, Bitcoin faced a swift rejection at this level that subsequently led the cryptocurrency to plummet back towards $8,700 – which is where it has been hovering at over the past few days.

Today’s early morning rally came about in tandem with an upsurge seen by Gold and the global equities markets, with the price action seeming to further confirm the cryptocurrency’s status as a risk-on investment.

The recent rejection also confirms that the crypto is weak at the moment, and it may suggest that it will see further downside before it finds enough support to catalyze a sustainable uptrend.

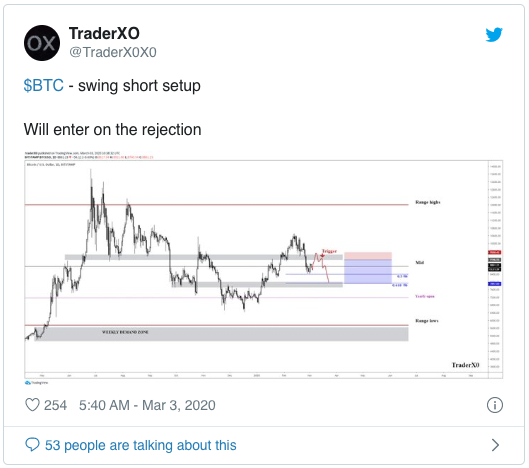
TraderXO, a prominent cryptocurrency analyst on Twitter, explained in a recent tweet that he believes BTC may see some further near-term upside, but that this will ultimately be followed by a sharp decline to lows of $7,900.

“BTC — swing short setup. Will enter on the rejection,” he noted while pointing to the levels seen on the chart below.

This Crypto Could Set Fresh All-Time Highs Despite BTC’s Weakness

Chainlink’s insane rally seen throughout 2019 and 2020 did slow down last week when the markets faced an intense selloff, but it has been able to significantly outperform Bitcoin and is now about to attack its previously established highs.

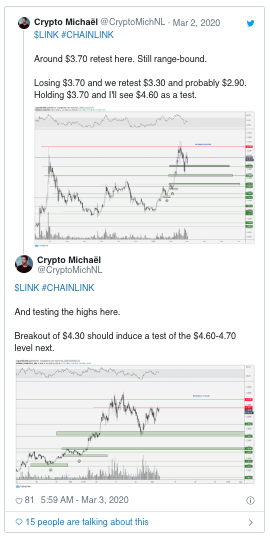
Crypto Michaël, a prominent cryptocurrency trader and analyst, explained in a recent tweet that a break above $4.30 could induce a rapid surge to, or past, its all-time highs at $4.80.

“And testing the highs here. Breakout of $4.30 should induce a test of the $4.60-4.70 level next,” he noted.

Because the crypto is currently holding above $4.30 despite Bitcoin’s current weakness, it does seem as though Chainlink’s strength will soon lead it significantly higher.

Featured image from Shutterstock.

Original article posted on the NewsBTC.com site, by Cole Petersen.

Article re-posted on Markethive by Jeffrey Sloe

‘You OK Boomer?’ Gold Sees Biggest Loss Since 2013 as Bitcoin Steadies

'You OK Boomer?' Gold Sees Biggest Loss Since 2013 as Bitcoin Steadies


Image courtesy of CoinTelegraph

            FEB 29, 2020

Bitcoin (BTC) saw a difficult week as it hit one-month lows, but on gold markets, traders were nursing the biggest daily falls in over seven years.

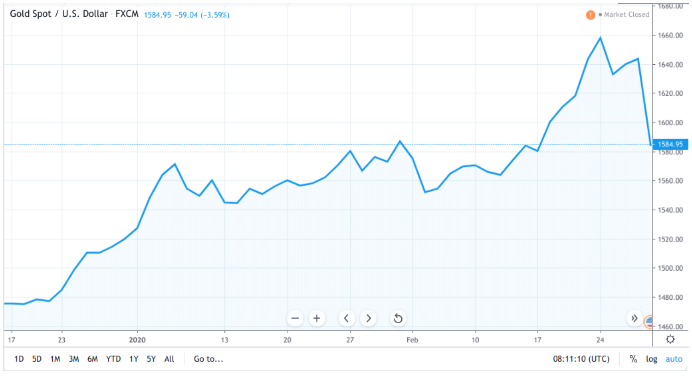
According to data tracking XAU/USD on Feb. 29, Friday saw the precious metal's worst 24-hour drop since 2013.

Gold drops 7% in 5 days after coronavirus sell-off

Over the past five days, gold broadly succumbed to the sell-offs affecting traditional markets due to the ongoing coronavirus outbreak. Between Feb. 24 and Feb. 29, XAU/USD lost a total of 7.3% before a slight rebound.

The fragile performance puts gold roughly on par with "digital gold," Bitcoin, the weekly losses for which currently stand at around 9%.

Gold year-to-date chart
Gold year-to-date chart. Source: TradingView

As Cointelegraph reported, after rebounding from 4-week lows of $8,450, the largest cryptocurrency returned to its forecast average price and has since attempted to reclaim its 200-day moving average near $8,800.

While gold remained steadfast in a plummeting stock market, its proponents had cause for celebration. Gold bug and infamous Bitcoin skeptic, Peter Schiff, took the opportunity to rubbish those who believed BTC could act as a safe haven.

Schiff: gold "not invalidated"

Following the U-turn in its fortunes, Schiff remained convinced in gold's promise, while acknowledging such drops were "very rare."

"Today's 4% drop in gold is a very rare move in a single day. But it does happen occasionally," he wrote in a tweet on Friday.

"However a 4% drop in @Bitcoin is quite common, which often posts daily declines much larger. Today's move doesn't invalidate gold's safe haven or long-term store of value status."

Bitcoin figures, notably Schiff's sparring partner Morgan Creek Digital co-founder Anthony Pompliano, had wryly suggested that someone should "check on" him as gold's own health waned.

Stock market misery meanwhile continues after the Dow Jones suffered its own record-breaking daily loss on Wednesday. Traders have since overwhelmingly bet on the United States Federal Reserve cutting its short-term interest rate target significantly in 2020.

Original article posted on the CoinTelegraph.com site, by William Suberg.

Article re-posted on Markethive by Jeffrey Sloe

BITCOIN BTC DROPS TO 9350 AS DOW JONES FALTERS BUT BULLS ARE STILL HOPEFUL

BITCOIN (BTC) DROPS TO $9,350 AS DOW JONES FALTERS, BUT BULLS ARE STILL HOPEFUL

Nick Chong   •   February 25, 2020

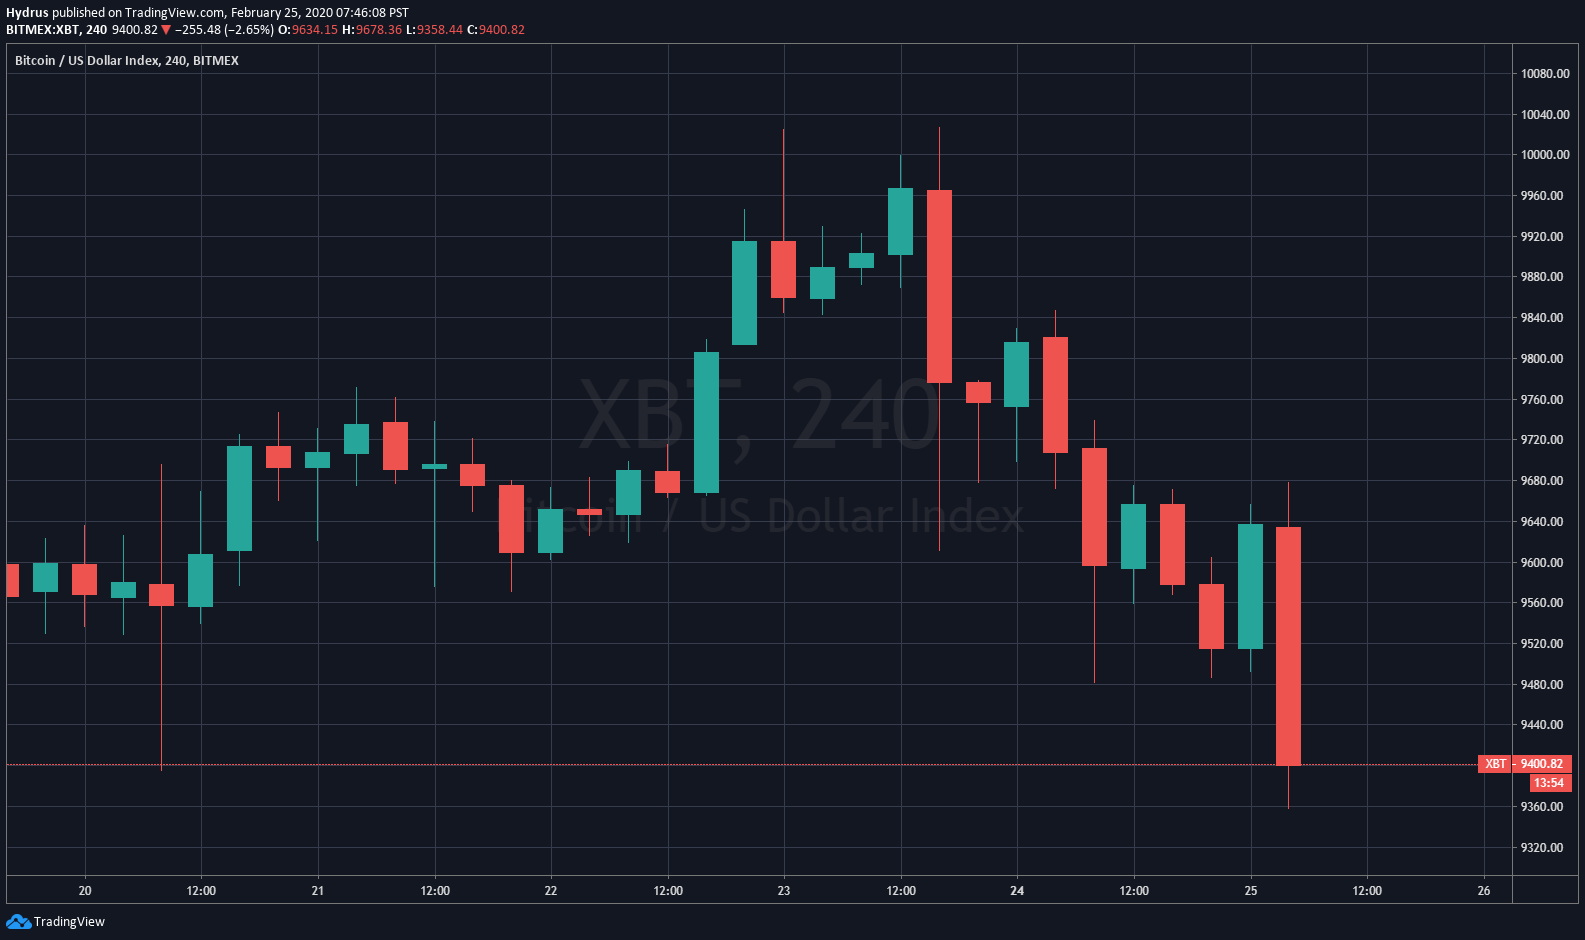
Over the past few hours, Bitcoin (BTC) has started to tank lower once again, reaching $9,350 just an hour or two ago on some exchanges. The asset has since seen a slight bounce, returning to $9,400.

This means that in the past 24 hours, the price of the leading cryptocurrency has fallen by 3.25%, crushed after reaching $10,000 on the weekend for just a brief moment.

Bitcoin’s weakness comes amid similar weakness in the traditional stock market, with the leading indices in the Dow Jones, S&P 500, and Nasdaq 100 recently selling off amid fears of the coronavirus spreading into the West and having a substantial economic impact.

Yesterday, the Dow Jones lost 1,000 points, plunging by 4%. It just so happened that BTC fell by a similar amount. Today, the same index is down 1%, while Bitcoin is also down.

Some have suggested that despite the cryptocurrency being classified by “digital gold” as many economists, it remains an asset that performs well in risk-on environments, meaning the stock sell-off hasn’t been conducive to the success of Bitcoin.

Not All Hope Is Lost for Bitcoin

While the recent drop obviously isn’t good for Bitcoin investors, for it liquidated over $40 million worth of BitMEX long positions, some are hopeful that a bullish bounce may soon be in store for this nascent market.

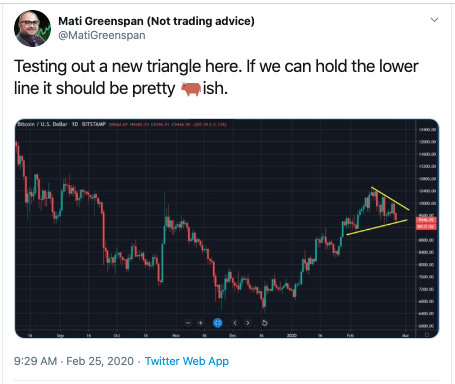
Quantum Economics’ Mati Greenspan remarked that BTC is currently trading in a symmetrical triangle-esque formation, with prices consolidating towards the apex. Symmetrical triangles are often seen as continuations higher when the leading price action is an uptrend (and vice-versa).

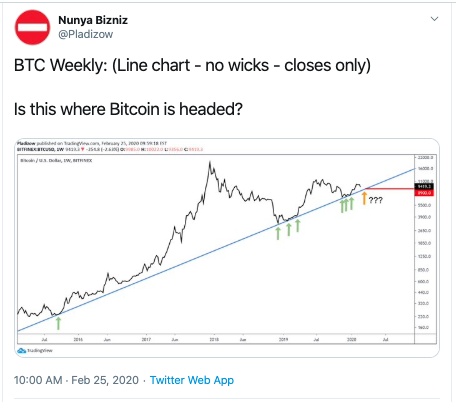
There’s also this chart from chartist Nunya Bizniz, which shows BTC’s price action on a weekly basis over the past four years. It suggests that Bitcoin has been trading in a clear logarithmic uptrend the entire time, with the asset bouncing off the support depicted on at least seven separate occasions.

History repeating will see BTC bounce at the uptrend, which is currently around $8,800-$9,000, depending on how fast the price gets there. This is important as bounces off this growth level are historically what led the asset into bull markets.

There have been some fears of a deeper correction though, with some analysts eyeing $8,500, as there exists a CME futures gap at that price, and some targeting even lower prices.

Original article posted on the EthereumWorldNews.com site, by Nick Chong.

Article re-posted on Markethive by Jeffrey Sloe

Bitcoin Bursts Past 10000 Again: Will Bulls Keep Up?

Bitcoin Bursts Past $10,000 (Again): Will Bulls Keep Up?

After reaching as low as $9,500 on Monday, Bitcoin started to trend higher. As of the time of this article’s writing on Tuesday, the cryptocurrency has reached as high as $10,300 — 8% higher than the local bottom but a few percent below the local top at $10,500.

The strong recovery from the key $9,500 level is bullish, for it confirms the uptrend structure of Bitcoin remains intact. Indeed, a number of analysts have said that the price of BTC’s recovery is a likely precursor to yet another thrust higher, a thrust that will bring this market to new multi-month highs.

Bitcoin’s Outlook Turns Positive Again Amid Recovery

The recent move higher has convinced many that Bitcoin is ready to move even higher.

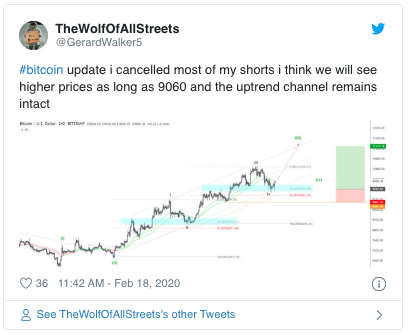
Gerald Walker, who has a moniker “The Wolf of All Streets,” remarked that Bitcoin remains in an ascending channel and is forming a wave pattern that will take it past $11,000 in the coming days.

The channel and wave he was referring to can be seen in the tweet below, which shows that Bitcoin bouncing off a crucial horizontal and diagonal support around a Fibonacci Retracement is priming the asset for a thrust to $11,000.

Walker added that as long as the $9,060 level stays intact, he expects to see “higher prices.”

Indeed, Bitazu Capital’s Mohit Sorout remarked that despite the retracement seen over the weekend, Bitcoin’s “market structure” remains intact, referencing the existence of a bull trend and the bounce off a key horizontal level.

Not to mention, the long-term uptrend remains decisively intact.

On Monday, analysts observed an extremely positive technical analysis signal: the 50-day simple moving average and the 200-day simple moving average crossed, with the former moving over the latter for the first time in nearly a year. This is called a “golden cross.”

Analysts have said that this validates the uptrend in the price of BTC, for it shows that a strong uptrend is forming.

Not to mention, Bitcoin’s holding above its 200-day moving average has always boded well for the cryptocurrency. An analysis from market research firm Fundstrat Global Advisors found that the average six-month gain for Bitcoin after it retakes its 200-day moving average is 197%, implying a price of over $20,000 by the middle of this year.

Original article posted on the EthereumWorldNews.com site, by Nick Chong.

Article re-posted on Markethive by Jeffrey Sloe

Bitcoin Price Fights to Hold 95K to Stave Off a Trend Reversal

Bitcoin Price Fights to Hold $9.5K to Stave Off a Trend Reversal


Image courtesy of CoinTelegraph

            FEB 20, 2020

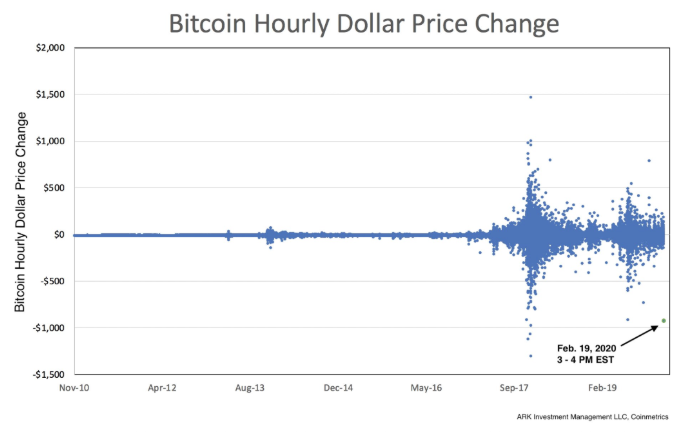
On Feb. 20 Bitcoin (BTC) price surprisingly dropped 8.85%, a move which caught many investors off guard as up to that moment the digital asset had recovered well from the President’s Day weekend correction and was trading sideways in the $10,200 range. Citing data from CoinMetrics, ARK Invest crypto analyst Yassine Elmandjra tweeted that the $1,000 price drop was the fifth largest USD correction to occur on the hourly time frame since 2017.
Since the sharp downside move, traders, analysts, and crypto-Twitter have been attempting to pinpoint the source of the flash crash and a handful of theories have arisen. Some have attributed the volatility to the consecutive unplanned Binance exchange outages which halted trading on the platform and prevented many traders from being able to log into their accounts.

Others, like, Cointelegraph contributor and Bitcoin trader filbfilb speculated that a shortage of Tether (USDT) at Binance could possibly have contributed to the current market conditions.

In his Telegram-based trading channel filbfilb explained that the USDT shortage possibly shows that the majority of traders were in long positions, an observation further supported by the decreasing pace of Bitcoin’s momentum and the liquidation of $120 million leveraged longs at BitMex.
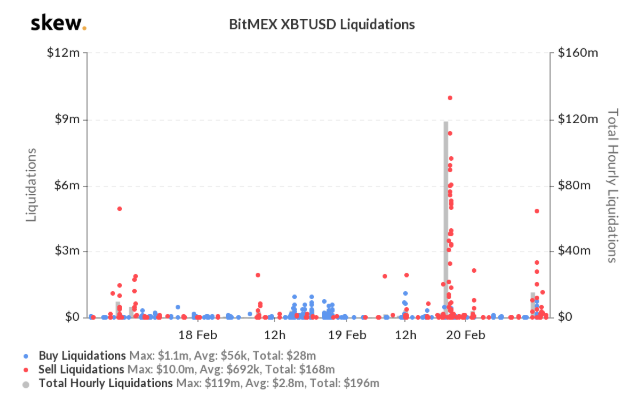

BitMEX XBTUSD Liquidations. Source: Skew.com

Regardless of the reason, the drop to $9,346 shook a lot of investors from their Bitcoin and altcoin positions and the current state of the market is negatively impacting investors’ bullish sentiment as they are choosing to wait on the sidelines for a clearer signal that a bottom has been reached.
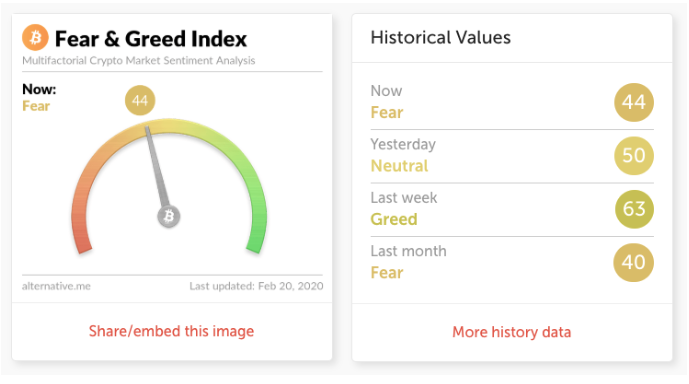

Crypto Fear & Greed Index. Source: Alternative.me

Is the current price action a buy the dip opportunity or is Bitcoin on the verge of a significant trend change? Let’s check the charts to see.

Excited traders overlooked the tweezer top
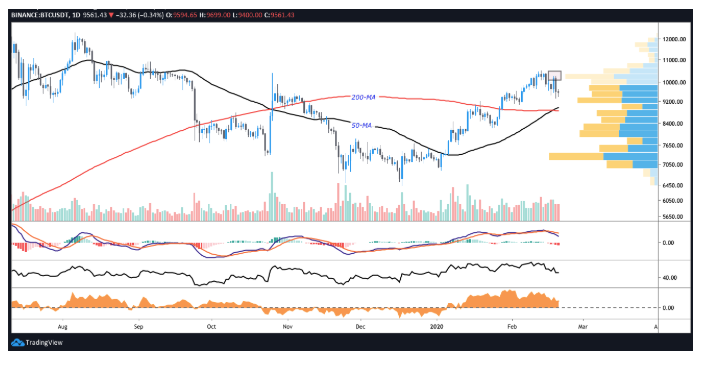

BTC USDT daily chart. Source: TradingView

As shown by the daily chart, Bitcoin formed a tweezer top candlestick pattern at $10,250 after recovering from the previous weekend’s drop to $9,450. This should have been a signal that the likelihood of a pullback could occur but traders were probably feeling bullish after Bitcoin’s quick recovery from $9,450 placed the digital asset back above key support levels.

Despite the shock caused by yesterday’s correction Bitcoin price still found support at the high volume node of the volume profile visible range (VPVR) at $9,300 to $9,438. While this is reassuring, some cautionary notes are low purchasing volume which highlights a lack of buyers interested in stepping into the current dip and the state of the two most frequently referenced oscillators by traders not yet registering oversold conditions.
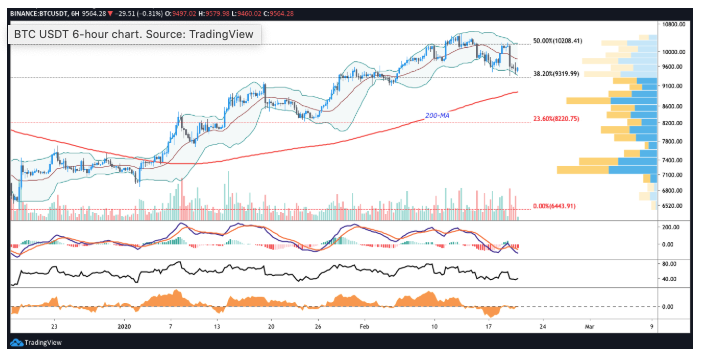

BTC USDT 6-hour chart. Source: TradingView

On the 6-hour timeframe, the relative strength index (RSI) has yet to manage an oversold bounce and the moving average convergence divergence (MACD) line continues to plummet, pressing on -100 at the time of writing.

Traders will also notice that the MACD histogram bars continue to elongate in negative territory (below 0) and the pattern of lower highs in the 6-hour chart is unbroken.

Bearish scenario

If buyers continue to believe the current price action is not a ‘buy the dip’ opportunity the price could drop below the VPVR high volume node ($9,438) and the 200-day moving average at $8,800 where there is another VPVR high volume node.

The shorter timeframe shows the price slowly making higher lows but the purchasing volume is not significant enough to hold the price above $9,600. Over the short-term, bulls need to defend the $9,500 support (black arrow on chart below) as the daily and weekly timeframe shows it to be a key level. A more significant trend change could push the price lower to $8,800 to $8,400.

Bullish scenario

If we zoom out to assess Bitcoin’s price action since reaching its 2019 top at $13,800 on June 26, 2018, we can see that the 38.2% Fibonacci Retracement level has been a frequent area where the price has bounced after strong corrections.
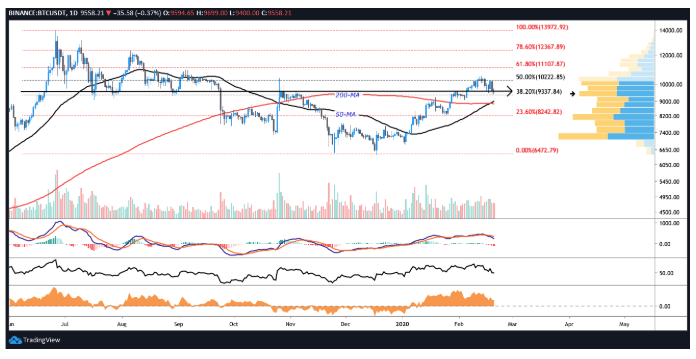

BTC USDT daily chart. Source: TradingView

Since June 26, 2018, the price has bounced here more than 10 times and yesterday’s pullback brought the price to the 38.6% level again. It’s crucial that the price stays above this level because the 38.6% Fibonacci retracement has also functioned as a strong resistance once the price dips below it.

On the flip side, assuming the price breaks out, we can also see that the last three Bitcoin rallies on October 12, 2019, February 12, 2020, and February 18, 2020, have failed to break above the 50% Fibonacci Retracement level. Thus, Bitcoin price needs to secure a few daily closes above $10,250 (50% Fibonacci retracement) before any calls for $11,000 can be seriously considered.

For the short term, Bitcoin price needs to knock out $9,630 and above this price, $9,750 is likely to function as a level of resistance. A more convincing maneuver would be to see Bitcoin price overtake the 20-MA of the Bollinger Band indicator and sustain above $9,850.

Original article posted on the CoinTelegraph.com site, by Horus Hughes.

Article re-posted on Markethive by Jeffrey Sloe

Eerie Pattern: Bitcoin to Shoot Up to 10600 Quick

Eerie Pattern: Bitcoin to Shoot Up to $10,600, Quick

After sustaining a nearly 4% loss over the past two days, Bitcoin started to recover on Friday, rallying as high as $10,380 just minutes ago as of the time of writing this.

While this isn't a strong recovery per se, for the asset remains below its local top of $10,550 (which analysts say is crucial for bulls to break across in the coming days), an eerie pattern suggests Bitcoin is going to rocket higher towards $10,600.

Bitcoin Could Soon Surge Higher

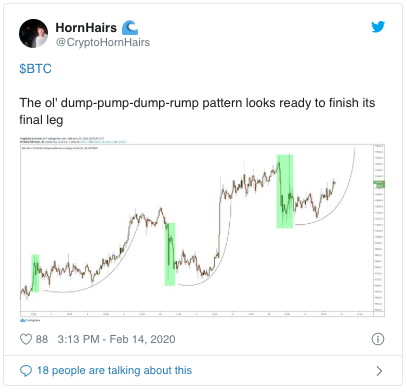
Prominent cryptocurrency trader HornHairs recently noted that Bitcoin's price action has exhibited a clear pattern over the past few days: the pattern sees BTC dump, pump in a parabolic fashion, and crash again as the parabola fails.

Bitcoin is currently in the middle stage, marked by rapidly-increasing prices. The parabola that is forming suggests the price of the cryptocurrency will top around $10,650, around 3.4% higher than the current price of the asset.

Although there is this bull case, a key sell signal just flashed per previous reports from Ethereum World News.

Nik Yaremchuk, an analyst and researcher at cryptocurrency fund Adaptive Capital, recently noted that with Wednesday's close, the one-day and two-day Bitcoin charts are printing simultaneous sell signals: the TD Sequential has printed a green 9s on both time frames.

This is more bearish than bullish because, for those unaware, the time-based TD Sequential prints 9 and 13 candles at reversal points in markets, for it signals that the trend is exhausted.

Close Above $10,500 Could Set Stage for Bigger Mov

While the above pattern suggests Bitcoin may crash after it sees a short-term parabolic spike into the $10,600 to $10,700, a daily or weekly close above $10,500, analysts say, will set the stage for an even larger move higher.

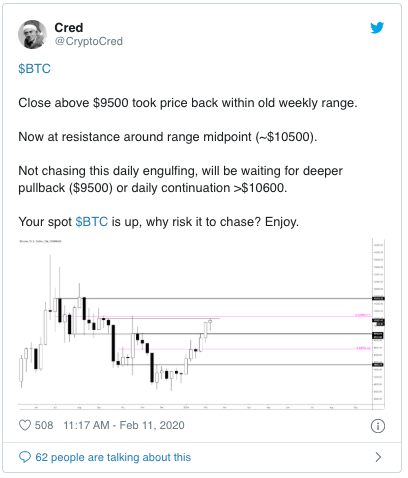
Prominent technical analyst Cred — who sports over 140,000 followers — remarked that since $9,500 has been breached, Bitcoin's nearest resistance is $10,500, the midpoint of the tried-and-true range between $9,500 and $11,500.

Though, Cred remarked that if Bitcoin can confirm a close above $10,600 — just a smidgen above the resistance he identified — prices will continue higher, likely unfettered until the other long-term resistance he identified at $11,500.

$10,500 is also important because this price point was the top of Bitcoin's rally in September 2019, which was caused by China's embracing of blockchain technologies in an unexpected fashion.

Original article posted on the EthereumWorldNews.com site, by Nick Chong.

Article re-posted on Markethive by Jeffrey Sloe

Why Has Bitcoin Rocketed to 10400? Exec Gives 2 Catalysts

Why Has Bitcoin Rocketed to $10,400? Exec Gives 2 Catalysts

Bitcoin’s face-ripping move higher over recent weeks has undoubtedly caught traders off guard.

Below is a tweet from Joseph Young, a leading cryptocurrency analyst/journalist, who noted that short sellers of BTC have seen millions of dollars of their positions liquidated throughout this move, accentuating how unexpected this move has been.

That leaves a pressing question — what has been Bitcoin so far higher over the past few weeks?

Why Has Bitcoin Been Moving So Far Higher?

Vijay Ayyar, head of business development at cryptocurrency exchange Luno, recently weighed in on the latest rally in the digital asset markets in an interview with CNBC, citing key factors that are likely behind the increased demand for Bitcoin and, as a result, altcoins.

The first factor he cited is the fears around the coronavirus outbreak, which have caused a fair bit of uncertainty in global markets. In China, a novel coronavirus has started to spread that purportedly has a high transmissibility rate and a relatively high mortality rate compared to the common cold, leading to many companies (both Chinese and international) seeing their supply chains affected, hurting markets.

Bitcoin is purportedly involved because people see the cryptocurrency as a “safe-haven investment” or “digital gold” that may actually benefit from chaos rather than suffer.

The second factor Ayyar touched on is recent comments from the Federal Reserve’s Jerome Powell regarding the importance of digital currency in today’s world.

In a Congress committee hearing on Tuesday, Powell said that the launch of the Facebook cryptocurrency, Libra, “lit a fire” under the rear-ends of the world’s governments and central banks, the Fed included. This seemingly confirmed that cryptocurrency has value in today’s world.

Other Factors in Play

While these two factors have gained a lot of steam as likely bullish catalyst, there are other factors at play likely affecting how investors allocate capital towards the cryptocurrency markets.

Namely, the upcoming block reward reduction or “halving,” after which the inflation rate of Bitcoin will be cut in half due to code built into the blockchain.

Prior to historical halvings, which take place every four years, Bitcoin rallied strongly, then tapered off slightly after the event due to mining factors; this is relevant because the ongoing rally may be similar to the previous pre-halving rallies.

Original article posted on the EthereumWorldNews.com site, by Nick Chong.

Article re-posted on Markethive by Jeffrey Sloe

BitGo Expands Custody Offerings To Switzerland Germany

BitGo Expands Custody Offerings To Switzerland, Germany

By RTTNews Staff Writer | Published: 2/11/2020 9:29 AM ET

U.S.-based digital asset financial services firm BitGo extended its operation to Europe by opening up two new regulated custodial entities in Switzerland and Germany – BitGo GmbH in Switzerland and BitGo Deutschland GmbH in Germany.

“We saw a lot of demand in Europe last year and it was clear that clients there needed to be able to work with European based firms that were regulated within specific jurisdictions,” said Mike Belshe, CEO of BitGo.

The entities will be regulated by different financial authorities. BitGo GmbH is a member of the Financial Services Standards Association (VQF), supervised by the Swiss Financial Market Supervisory Authority (FINMA).

BitGo Deutschland GmbH is currently providing custody services in Germany and will apply for regulatory approval when the application window opens in November 2020.

Switzerland and Germany have both become important European centers for digital assets with forward-thinking regulatory frameworks.

BitGo introduced the first regulated custodian purpose-built for digital assets in 2018 when it launched BitGo Trust Co. in the U.S. and has seen strong adoption. BitGo clients can now select the jurisdiction that is the best fit for their business.

BitGo, backed by Michael Novogratz’s Galaxy Digital Ventures and Goldman Sachs, is a provider of institutional cryptocurrency financial services, providing clients with a set of security, compliance, and custodial solutions.

BitGo claims to processes more than about 20 percent of all global Bitcoin transactions. It supports over 250 coins and tokens, and its customer base includes the world’s largest cryptocurrency exchanges and spans more than 50 countries.

In February last year, BitGo partnered British insurer Llyod’s of London to provide insurance protection for cryptocurrencies and digital assets such as Bitcoin held in their Business Wallet and Custody offerings. Llyod’s is providing insurance for up to $100 million of custodial assets held by either BitGo, Inc., or BitGo Trust Co.

For comments and feedback contact: editorial@rttnews.com

Article written by an RTT News Staff Writer, and posted on the RTT News.com website.

Article reposted on Markethive by Jeffrey Sloe

Coinbase Says Bitcoin Will Become Closer to Digital Gold in 93 Days

Coinbase Says Bitcoin Will Become Closer to Digital Gold in 93 Days


Image courtesy of CoinTelegraph

            FEB 08, 2020

With May’s Bitcoin halving event drawing ever closer, Coinbase recently took to pushing the “Bitcoin as digital gold” narrative. In a tweet-storm to promote an accompanying blog-post published Feb. 7, it covered the key reasons why the halving and subsequent supply rate reduction will further cement that link.

Scarcity creates value

Since the gold standard was broken in 1971, the dollar’s value has declined and gold’s value, in dollar terms, has risen over 4000%. Gold has more value than similar metals such as copper due to its relative scarcity and difficulty to acquire.

Bitcoin has been designed to be scarce like gold and is artificially difficult to acquire through the Proof-of-Work process of mining. However, it also has an advantage over gold in being transferable through a communications channel.

Coinbase concluded:

“Armed with a myriad of technological advantages, accelerating development, and maturing global market, Bitcoin is a store of value to rival gold in the digital age.”

Halving increases scarcity

The supply of Bitcoin is limited by design, with new tokens being minted as a reward every time a block of transactions is mined. The initial reward level of 50 BTC per block has already undergone two halving events, bringing it down to the current 12.5 BTC per block.

After the May 2020 halving, mining rewards for each new block, mined approximately every ten minutes, will reduce to 6.25 BTC. This will bring the supply issuance of Bitcoin to a rate of around 1.7% per annum.

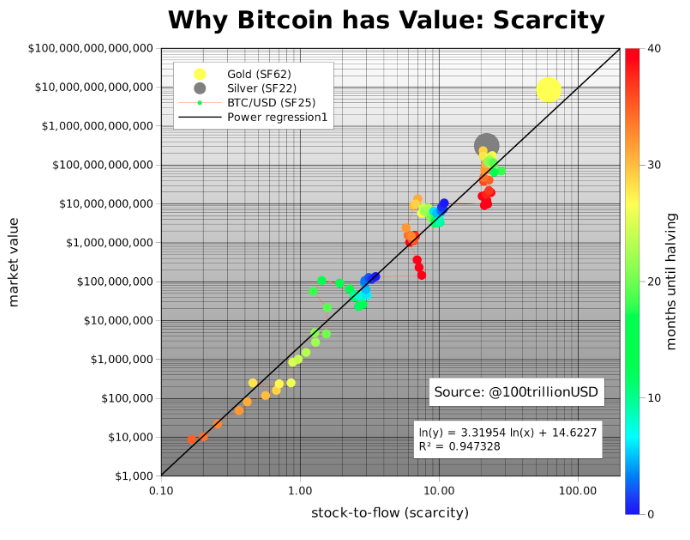
Stock-to-flow (S2F) is a measure of new supply rate over total supply, and post-halving, Bitcoin’s S2F scarcity will be on a par with gold’s.

“Gold’s stock to flow is higher than any other metal commodity, and bitcoin is set to soon follow,” notes Coinbase.


Bitcoin stock-to-flow chart. Source: medium.com/@100trillionUSD/

No value without demand

S2F forecasts for the price will fail if there is no demand, and this holds true for fiat money, as much as any other commodity. As central banks increase the money supply, economies can sometimes prosper. However, if money supply overwhelms demand then hyperinflation events can occur.

Such events drive demand for safe havens such as gold and Bitcoin, and recent economic fear is reaching all-time highs, according to the Global Economic Policy Uncertainty Index.

This, along with Bitcoin’s myriad of technological advances and accelerating development, justifies Bitcoin’s title as digital gold, according to Coinbase.

As Cointelegraph reported, senior employees of Coinbase and Ripple recently formed a working group to advise United States regulators on policies to encourage innovation in the sector.

Original article posted on the CoinTelegraph.com site, by Jack Martin.

Article re-posted on Markethive by Jeffrey Sloe

Bitcoin Prints Massive Buy Signal Suggesting Price Will Soon Retake 10000

Bitcoin Prints Massive Buy Signal, Suggesting Price Will Soon Retake $10,000

Bitcoin (BTC) has been on a near relentless rally over the past few weeks, bounding past key price points in the $7,000s, then $8,000s, then most recently in the $9,000s. The cryptocurrency, while already up 50% in the past 45 to 50 days, still has more upside, per some prominent analysts, citing a flurry of technical factors that suggest more upside is imminent.

Bitcoin Prints Key Bullish Signal

Bitcoin’s strong rally over the past few weeks have allowed the cryptocurrency to print a flurry of positive signals on its charts.

Most recently, as pointed out by popular TradingView analyst TradingShot, the Ichimoku Cloud — a multi-faceted indicator that lets analysts determine market trends and key price points — just gave the “strongest BULL SIGNAL possible” on the daily chart for Bitcoin.

They wrote in the TradingView point that the last time the Cloud twisted bullish was in April 2019, which was prior to the over 200% rally that took Bitcoin from the $4,000s to $14,000 in a few months’ time in a parabolic fashion.

They added that with Bitcoin bouncing off the 1,000-day moving average in December 2019, that drop was likely the “bottom of the June correction,” noting that the prices around the moving average are a region where BTC classically bottomed in previous bear markets.

TradingShot’s observation of a bullish Ichimoku cross isn’t the only thing that has traders excited for the prospects of Bitcoin in the coming months.

Cryptocurrency trader Brent or Blockchainblitz recently noted that Bitcoin’s daily chart just registered a key technical signal: the 50-day moving average just today crossed above the 100-day moving average, creating a bull cross formation.

He notes that in the past eight times this technical signal was seen since 2014, a “rip upward followed.”

Indeed, our own analysis of this specific moving average cross found that this last took place when BTC was at $5,800 in early-2019, and preceded a 140% move higher. There are also the other historical instances Brent pointed to in his chart.

This confluence suggests that more upside is likely, though it is important to note short-term pullbacks can be sustained by the market to make sure that Bitcoin is not overextended.

Original article posted on the EthereumWorldNews.com site, by Nick Chong.

Article re-posted on Markethive by Jeffrey Sloe