Bitcoin Now Has A Lower Inflation Rate Than Gold After Successfully Undergoing Its Third-Ever Halving

Bitcoin Now Has A Lower Inflation Rate Than Gold After Successfully Undergoing Its Third-Ever Halving

By Brenda Ngari – May 11, 2020

The block reward halving for the pioneer cryptocurrency, which was definitely the most awaited event this year has finally taken place. As a result, the rate at which new bitcoin’s are minted has just reduced by 50% for the third time in the coin’s history.

Bitcoin Undergoes Third Halving

At exactly 3.23 PM EST on May 11, the 630,000th block was mined by AntPool, initiating the scheduled halving event, according to data provided by Tradeblock. This block consisted of 3,134 transactions with an estimated transaction value of 3311.62144322 BTC. Chinese bitcoin miner F2Pool mined the last block before the halving took place.

Halving is a quadrennial event, meaning it occurs every four years (or after every 210,000 blocks). This event is basically a stroke of genius that aims to put a lid on the inflation of BTC by reducing the rewards for mining blocks on the bitcoin network. 

After the halving that just occurred, miners’ rewards have reduced from 12.5 BTC to 6.25 BTC. The bitcoins produced daily will, therefore, reduce from 1,800 to 900 units. Bitcoin’s inflation rate will subsequently go down to 1.8%. This means that the OG cryptocurrency now has a lower annual inflation rate than gold.

The first-ever halving took place in 2012 which saw the rewards reduce from 50 BTC to 25 BTC. The second one then happened in 2016 and the rewards were slashed from 25 BTC to 12.5 BTC. 

Possible Effects Of The Halving

The immediate effect of the halving will be felt by the network’s miners. Due to the reduced revenue, small miners will be forced to turn off their rigs as the production cost is expected to double to $14,000 -around 70% above the current prices. Capriole’s Charles Edwards sees a huge miner capitulation in the near-term.

Nakamoto designed that the gradual reduction of rewards would slow down the number of bitcoins minted every 10 minutes. With a hard-capped supply of 21 million, BTC is on track to becoming one of the most scarce assets in the world.

As the supply shrinks, assuming the demand remains constant, the price is expected to skyrocket and print new all-time highs. The impact of the third halving on the price of bitcoin is, however, a hotly debated topic in the cryptocurrency community. While some believe the halving is basically a non-event, others are certain that it is very bullish for the price of bitcoin in the coming months based on historic performance.

However, due to the unpredictability of the cryptocurrency market, whichever way the bitcoin price or miners may go remains to be seen. The digital asset is valued at $8,685.33 at press time, with 0.22 percent gains over the last 24-hour period.

ecosystem for entrepreneurs
Markethive Advertisement

DISCLAIMER

The views expressed in the article are wholly those of the author and do not represent those of, nor should they be attributed to, ZyCrypto. This article is not meant to give financial advice. Please carry out your own research before investing in any of the various cryptocurrencies available.

The original article written by Brenda Ngari and posted on ZyCrypto.com.

Article reposted on Markethive by Jeffrey Sloe

Cryptocurrency Bitcoin Halving Again

Cryptocurrency Bitcoin Halving Again

By RTTNews Staff Writer | Published: 5/11/2020 12:04 PM ET

The world's most popular cryptocurrency Bitcoin (BTC) is set to halve again for a third time. This means the reward given to Bitcoin miners for processing transactions is being cut by 50 percent. This also means that the rate at which new Bitcoins enter circulations are halved.

Bitcoin has generally ended with higher prices after the completion of halving, as it happened during the halving in November 2012 and July 2016. It all began in 2007, when the total number of new Bitcoin mined by miners per block was at 50 or 50 Bitcoins entering circulation every 10 minutes, which is the normally quoted Bitcoin block time.

The halving was necessitated nearly every four years as Bitcoin's anonymous inventor Satoshi Nakamoto decided that only 21 million BTC would ever exist. The total number of Bitcoin mined by miners per block was reduced to 25 BTC in 2012 and it was further halved to 12.5 BTC in 2016. It is now being slashed to 6.25 BTC.

New Bitcoin mined by miners per block is also called block reward, which is an important aspect of Bitcoin mining. This is the economic reward for the mining activity, which involves high power mining systems and usage of an enormous amount of electricity.

In anticipation of today's Bitcoin halving event, BTC has been volatile for the past few days with the price of BTC touching $10,000 last week and crashing more than $2,000 in the past two days to hit a price of $8,100. BTC is currently trading at 8941.29, up 3.02 percent in the past 24 hours.

For comments and feedback contact: editorial@rttnews.com

ecosystem for entrepreneurs
Markethive Advertisement

Article written by an RTT News Staff Writer, and posted on the RTT News.com website.

Article reposted on Markethive by Jeffrey Sloe

Bitcoin BTC Whale Leaves Twitter Reappears on Bitfinex Pulse

Bitcoin (BTC) Whale Leaves Twitter, Reappears on Bitfinex Pulse

@Joe007 bid farewell to Crypto Twitter only to reappear on Bitfinex's social network, Pulse.

John P. Njui   •   BITCOIN NEWS   •   May 10, 2020   •   2 Min read

In brief:

  • @Joe007 is a famous Bitcoin whale who for a long time, thrived on Twitter.
  • His trades were legendary with his profits running into the millions on Bitfinex.
  • Days after moving on from Twitter, he has reemerged on Bitfinex pulse.

Earlier today, Bitcoin (BTC) pulled a fast one on unsuspecting traders as its value dropped quick and fast from around the $9,600 support zone to $8,100. This move came a few hours before the Bitcoin halving which is now a day away. Many traders were anticipating that such a dip would happen after the halving in a classic ‘buy the rumor, sell the news' type of way.

@Joe007 Leaves Twitter To Protect His Trading Setups

The sudden drop in price has had many retail traders concluding that it was Bitcoin whales who saw an opportunity to short BTC and did so en masse. One such whale who is famous for shorting Bitcoin is @Joe007 who recently walked away from crypto twitter on May 7th. @Joe007 deleted his Twitter account around the same time BTC hit $10,000. His departure led many to speculate that he left because of the loss he incurred from shorting BTC from around $6,800.

However, @Joe007 posted an elaborate thread on Twitter where he explained his departure as a way of protecting his trading setups:

…I can't really afford Twitter. There are many reasons why I can't stay, unfortunately.

Here is one. Trading is a dangerous, adversarial, high-stakes info game. It's played against best-in-class, looking for any advantage. Your trade results and views being public gives them too much advantage over you. There are tools reconstructing my portfolio out there already.

@Joe007 Reappears on Bitfinex Pulse

However, trader @Joe007 has reappeared on Bitfinex Pulse commenting on the recent sudden drop of Bitcoin via the following meme that was brought to our attention by the exchange's CTO, Paolo Ardoino.

What is Bitfinex Pulse?

Launched in late April this year, Bitfinex Pulse is the crypto exchange's homegrown social network that lets traders connect with each other and perhaps share ideas. The main aim of the platform is to provide an avenue for crypto content sharing. The announcement by Bitfinex launching the platform further explains this as follows.

In response to customer demand, we're excited to announce the launch of Bitfinex Pulse, a social networking platform enabling our customers to connect with each other and get a trading edge.

The launch of Bitfinex Pulse provides our growing customer base with a specialist crypto content distribution platform for traders. The platform will serve as an intuitive and fun way for our users to interact and share crypto news and views on market trends and developments.

(Feature image courtesy of Todd Cravens on Unsplash.)

ecosystem for entrepreneurs
Markethive Advertisement

Original article posted on the EthereumWorldNews.com site, by John P. Njui.

Article re-posted on Markethive by Jeffrey Sloe

Bitcoin’s Bullish Force Hits Fever Pitch As Options Open Interest Surpasses 1B For First Time In History

Bitcoin’s Bullish Force Hits Fever Pitch As Options Open Interest Surpasses $1B For First Time In History

By Brenda Ngari – May 8, 2020

Since BTC’s incredible rebound from the Black Thursday market rout in March, the pioneer cryptocurrency has been incredibly bullish. Bitcoin’s recent rally has ignited new hopes for a full-flown rally just in time for the halving slated for Tuesday.

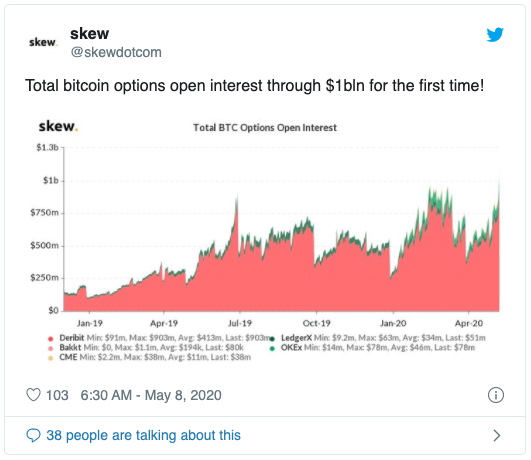
Besides the ongoing rally, the bitcoin options market is booming. According to data, the total options open interest recently crossed the $1 billion mark for the very first time in history.

Total Bitcoin Options Open Interest Reach $1 Billion

It’s an open secret that bitcoin (BTC) has been breaking records this week. Just days ago, the top crypto’s difficulty and hash rate hit fresh all-time highs ahead of the block halving event.

The upcoming halving -which will see miners’ rewards reduced from the current 12.5 BTC to 6.25 BTC- is undoubtedly the hottest topic in the cryptosphere right now. This event happens every four years and was designed to keep a lid on BTC’s inflation. Market pundits have indicated time and again that the event has always preceded a monstrous rally. It appears that all market participants are taking note of it.

Incredibly, on May 7, bitcoin broke another record -this time, in the options market. According to data relayed by crypto derivatives monitoring firm Skew, the total bitcoin options open interest hit $1 billion.

This is the first time the combined volume of bitcoin options volume from Deribit, LedgerX, CME, and Bakkt broke above $1 billion. Deribit exchange took the lion’s share with a $903 million volume, representing almost 90% of the total options positions. OKEx and LedgerX took the second and third largest share of the open interest for bitcoin options, with a total of $78 million and $51 million respectively.

The growth in the total options open interest is a notable spike from the roughly $400 million options trading volume seen during the mid-March debacle.

Can BTC Successfully Conquer The Elusive $10K Level At Halving?

The increase in open interest offers some hope of BTC firmly reclaiming the $10,000 psychological level. Skew noted yesterday that the options volume for CME, in particular, are soaring. This means that more investors are participating in the bitcoin market.

Moreover, bitcoin recently zipped past $10,000, adding to the bullish sentiments in the cryptocurrency market. Most people are expecting the top crypto to demolish the $10k hurdle in the near term.

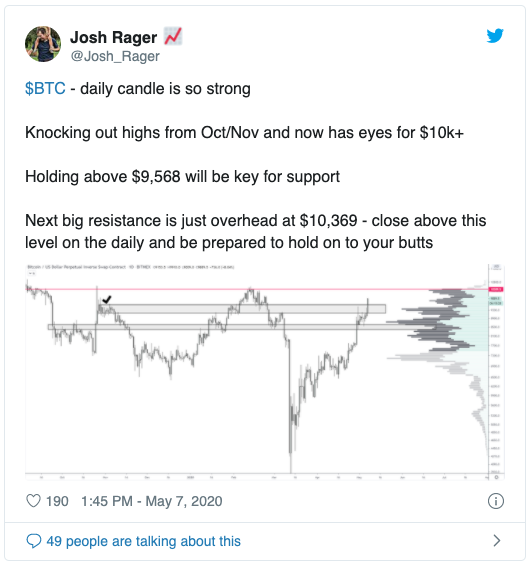
Meanwhile, should a pullback happen in the short-term, analyst Josh Rager expects the $9,500 level to act as sturdy support. The next resistance lies at $10,369. Clearing this level should open the door for the bitcoin price to push even higher.

DISCLAIMER

The views expressed in the article are wholly those of the author and do not represent those of, nor should they be attributed to, ZyCrypto. This article is not meant to give financial advice. Please carry out your own research before investing in any of the various cryptocurrencies available.

ecosystem for entrepreneurs
Markethive Advertisement

The original article written by Brenda Ngari and posted on ZyCrypto.com.

Article reposted on Markethive by Jeffrey Sloe

Top Analyst: Bitcoin BTC amp Crypto Could Hit New Highs if Fiat Fails

Top Analyst: Bitcoin (BTC) & Crypto Could Hit New Highs if Fiat Fails

Global investors losing confidence in traditional fiat might propel BTC and Crypto to new highs.

John P. Njui   •   BITCOIN NEWS   •   May 8, 2020   •   2 Min read

In brief:

  • Top analyst, @MagicPoopCannon, is cautious regarding the recent rally of Bitcoin (BTC) to $10k.
  • He cites that Bitcoin's daily RSI as being overbought.
  • He points out that the stock market is not out of the woods yet and any move down will impact BTC and other cryptos.
  • Additionally, he puts forth one scenario where BTC and Crypto will thrive due to investors losing faith in the global fiat systems.

The Bitcoin (BTC) halving event is now 3 days away and interest in the King of Crypto and the industry, in general, has risen in the past few days. Clear proof of a renewed interest in Bitcoin can be seen in BTC recently testing $10,000 and trading at $9,980 at the time of writing this. Additionally, the industry got a massive boost only yesterday when legendary Paul Tudor Jones, let the trading community know, that he too was buying Bitcoin.

Bitcoin and Crypto Could Hit New Highs if Fiat Fails

Mr. Jones' key reason for deciding to invest in Bitcoin, is his forecast of possible inflation brought about by the Fed and other global central banks, constantly printing fiat to cushion against the economic effects of COVID19.

His views are mirrored by top Bitcoin and Crypto analysis, @MagicPoopCannon in his latest Tradingview analysis of BTC. In the detailed post, Magic postulates one scenario where Bitcoin and Crypto are propelled to new highs due to investors losing confidence in the traditional fiat systems. His statement putting forth the idea can be found below.

..there's one thing that I think can really propel crypto to new heights at this point — and that's a loss of confidence in traditional fiat currency systems. Given the extraordinary worldwide debt crises, and the absolutely reckless monetary expansions of global central banks, we could see a loss of confidence in fiat soon enough.

Daily RSI is Overbought

Regarding technical indicators, Magic was quick to comment that Bitcoin's daily RSI was massively overbought and could result in a situation where BTC takes a dip.

..it's probably wise to exercise caution here. You can see that the RSI is in overbought territory. So, there's a chance that BTC could turn back to the downside…

Wise to Keep an Eye on the Stock Markets

Additionally, Magic highlighted that Bitcoin was not yet immune to the effects of a collapsing stock market. In his analysis, he advised that it would be wise to keep an eye out for any pending crash in the traditional markets.

My primary concern is the state of the equity markets. I'm worried that the stock market has become irrationally exuberant in the recent rally, and I think it's likely that we could see another retest of the lows, and potentially even lower lows than what we saw in the past few months.

So, if the equity markets turn lower, and we see a continuation of the recession, I think it would be practically guaranteed that crypto would continue to get punished.

(Feature image courtesy of Unsplash.)

Disclaimer: This article is not meant to give financial advice. Any additional opinion herein is purely the author’s and does not represent the opinion of Ethereum World News or any of its other writers. Please carry out your own research before investing in any of the numerous cryptocurrencies available. Thank you.

ecosystem for entrepreneurs
Markethive Advertisement

Original article posted on the EthereumWorldNews.com site, by John P. Njui.

Article re-posted on Markethive by Jeffrey Sloe

Bitcoin BTC Space Program – Blockstream Enters Phase Two

Bitcoin (BTC) Space Program – Blockstream Enters Phase Two

  •   Ethereum News   •   May 6, 2020   •   Bitcoin News

The Canadian company Blockstream has just launched a new version of its satellite network for Bitcoin (BTC) as well as satellite kits for individuals.

The Blockstream Satellite system broadcasts the Bitcoin blockchain to the entire planet all day, every day for free, reducing Bitcoin’s dependency on internet access. By upgrading the Blockstream satellite network which carries the Bitcoin blockchain, the data is now 25x quicker and additional coverage areas, so everyone in the world now has an opportunity to utilize Bitcoin and sync an entire node without having to connect to the internet.

How does it work?

Blockstream Satellite ground stations known as "teleports", participate in the Bitcoin network and transmit blocks to geosynchronous satellites. Blockstream, has 6 geostationary active satellites that are used to broadcast Bitcoin, with locations in North America, South America, Africa, Europe, Asia/Pacific.

The Geosynchronous satellites, receive the signal from the "teleports" ground units and broadcast it across the globe. Anyone in the coverage area with a USB receiver or small satellite antenna, can receive these blocks & keep their nod always in sync. This way, the whole Blockstream Satellite system shapes a ring around the planet to guarantee that the BTC network has full redundancy.

The Entirety of Bitcoin, Transmitted from Space

The report said:

“Instead of requiring users to connect their Bitcoin full node to the internet for the initial sync—as was the case with 1.0—Blockstream Satellite 2.0 now enables full history synchronization! Blockstream Satellite users can hook up a Bitcoin full node and fully download the entirety of the Bitcoin blockchain, from the original 2009 genesis block right up to today’s latest transactions…absolutely no internet required!”

This development follows the launch of the 1.0 network in August 2017, as well as the update that extended network coverage to the Asia-Pacific region (in addition to South America, the Europe and Africa), and the launch of the beta API of the Blockstream satellite (Lightning-powered message API). The 1.0 network will be deactivated on June 1, leaving the hardware still compatible with the 2.0 network, but requiring a software update and the switch to the new 2.0 service.

ecosystem for entrepreneurs
Markethive Advertisement

Original article posted on the EthereumWorldNews.com site, by Adrian S. Mathieu.

Article re-posted on Markethive by Jeffrey Sloe

Bitcoin Hasn’t Done This Since 2015 Before Its 10000 Bull Run

Bitcoin Hasn’t Done This Since 2015 Before Its 10,000% Bull Run

Bitcoin price experienced a huge 20% surge in value last week, but one indicator suggests BTC could still be in a downtrend.


Image courtesy of CoinTelegraph

            MAY 03, 2020

The price of Bitcoin (BTC), the top-ranked cryptocurrency, currently sits around $9,000, after last week's impressive 20% rally in a single day.  With the halving now less than 2 weeks away, it might seem like a no brainer to go long on Bitcoin to catch the next explosive move.

However, there is one chart view that suggests we may have topped out, and that is what I'll start with today.


Daily crypto market performance. Source: Coin360.com

If in doubt, zoom out


BTC USD daily chart. Source: TradingView

In last week's analysis, I shared two possible ascending channels, one of which was invalidated leaving one in play. This week, I want to look at the possibility that we were not inside either channel and the fact we could still be in a downtrend since the June 2019 pump that almost hit $14,000.

The upper trend line is validated by three touches. However, the lower trendline of this channel puts the immediate downside as low as $3,000 with the moving average around $6,300. These are not numbers that I expect Bitcoin to see again, but it would be foolish to not be prepared for it.

The Fib hints at what a breakout could bring


BTC USD daily chart. Source: TradingView

The Fibonacci retracement levels from the ATH of $20K per Bitcoin are showing us that a breakout today could see us return to much higher levels than previously expected.

$9,550 is the critical level to focus on. It's both the 0.382 Fib and the top of the channel.  Claiming this level could see Bitcoin soar towards the 0.5 Fib of $11,50,0 which then realistically puts the 0.618 Fib of $13,500 on the table.

Now that's all well and good, but "number go up" doesn't always happen, and one such indicator that can be relied on to confirm the direction we’re headed based on the current momentum is the monthly Moving Average Convergence Divergence indicator or MACD. 

MACD monthly analysis


BTC USD monthly MACD chart Source: TradingView

Last week, I highlighted the significance that the moving average divergence convergence (MACD) Indicator has on the price of Bitcoin when it crosses bullishly on the weekly timeframe.

However, with the bullish monthly candle close comes a new picture for the monthly MACD. Mapped out above is the monthly MACD bullish and bearish crosses with the weekly MACD bullish crosses highlighted with the dotted lines — green for bullish crosses that saw a big run after, and red dotted lines for the false bullish crosses.

The reason for this map is to see if there are patterns that match with the 2017 weekly bullish cross that saw a 2,000% rise. But it's also useful to see if the higher time frame view is showing us any contradictory momentum that could suggest a dump is due soon.

Moving from the left to the right of the chart, what this shows is that back in March 2017 when the weekly MACD crossed bullish, the monthly MACD was already in a bullish crossover from 2015.

Thus, at the point of the weekly bullish crossover, both the MACD and signal lines were on an upward trajectory. This resulted in a 2,000% increase in price for Bitcoin from the point of the weekly cross.

Later on, the false bullish crossover on the weekly in September 2018 shows us that the monthly MACD and signal line were both in a downward trajectory and that the monthly MACD was already crossing bearishly. Thus, the higher timeframe momentum was signaling that the move from weekly MACD crossover may not be valid.

The February weekly bullish crossover seemingly has exactly the same conditions as the September crossover with one difference. The histogram on the monthly MACD was losing downward momentum as can be seen by the paler pink color compared to the darker pink in the previous crossover. In this case, it resulted in a 400% increase in the price of Bitcoin.

Now looking at the 2020 momentum, we can see that the monthly MACD was chopping and changing direction between December and February, which led to the signal line and MACD  having a sidewards trajectory — quite literally a first for Bitcoin.

But if you've read this far, and you're still following where I am going with this, the monthly signal line is on an upward path for the first time since October 2015, back when Bitcoin was just $200 per coin, and if you take this to the $20K all-time high, that's a monstrous 10,000% or 100x move. 

So with this in mind, will the next bullish cross on the monthly MACD happen in June? Are we in store for a 10,000% increase from the current price? Only time will tell.

Bitcoin starting to breakdown


BTC USD 1 hour chart. Source: TradingView

Drilling down to the hourly now, and we can see that  Bitcoin was starting to form a pattern of lower highs and higher lows after its big leg up last night.

Typically this signals a potential continuation of the previous trend, and the upside potential is around $9,600. And if we had held this level for a candle close on the daily, then next week would have looked to be incredibly bullish.

As this has just broken down, a pullback to $8,400 throughout the week is to be expected. 

The views and opinions expressed here are solely those of @officiallykeith and do not necessarily reflect the views of Cointelegraph. Every investment and trading move involves risk. You should conduct your own research when making a decision.

ecosystem for entrepreneurs
Markethive Advertisement

Original article posted on the CoinTelegraph.com site, by Keith Wareing.

Article re-posted on Markethive by Jeffrey Sloe

Bitcoin BTC Outperforms Gold in YTD Returns

Bitcoin (BTC) Outperforms Gold in YTD Returns

The question as to which is a better hedge during a financial crisis is finally being answered.

John P. Njui   •   Ethereum News   •   April 30, 2020   •   in Discover the Latest Cryptocurrency News Today

In brief:

  • The debate as to which asset between Gold and Bitcoin (BTC) is a better hedge during a financial crisis has found a testing environment as a result of the economic impact of COVID19.
  • An analysis of both assets results in Bitcoin (BTC) outperforming Gold in Year-to-Date returns.

The question as to which asset between Gold and Bitcoin (BTC) is a better hedge during a financial crisis is finally being answered. The Coronavirus Induced global recession has provided the perfect testing ground to finally put to rest the debate as to which asset is a better store of value. The CEO of Pantera Capital, Dan Morehead, posted the following tweet that showcased that Bitcoin (BTC) was ahead of Gold in terms of Year-to-date returns.

Updated YTD Gains of Both Bitcoin (BTC) and Gold

At the time of writing this, Bitcoin (BTC) is valued at $8,830 and Gold at $1,705. Going back to the 1st of January, BTC opened the year at a value of approximately $7,200 with Gold ushering in the New Year at a value of approximately $1,500. Doing the math, we find YTD returns of 22.6% for Bitcoin and 13.33% for Gold.

Therefore, Bitcoin has increased its YTD gains since Mr. Morehead tweeted his observation.

What’s Next for the Financial and Cryptocurrency Markets?

With regard to the future of both the crypto and stock markets, there is still a sense of uneasiness as the world continues to cope with the spread of COVID19. However, the announcement of promising results when using Remdesivir to reduce the recovery times of Coronavirus patients has brought back much-needed optimism not only in the markets but also in the medical world.

Additionally, the Bitcoin (BTC) halving is now less than 2 weeks away and the King of Crypto seems set to shrug off the earlier identified correlation with the S&P 500 as it attempts to hold the $8,800 – $8.600 support area in preparation for another push up.

Brief T.A of Bitcoin (BTC)


BTCUSDT Daily Chart Courtesy of Tradingview.com (Click on image for larger view)

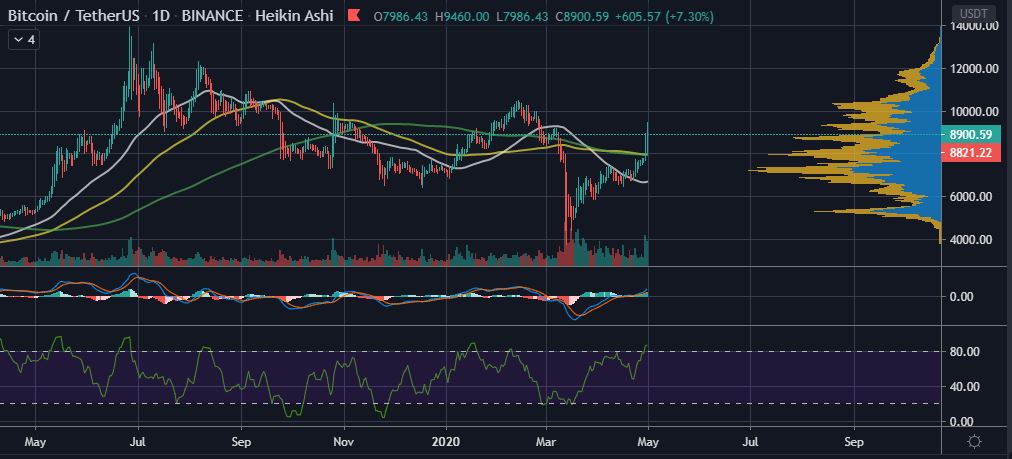
Further checking the daily BTC/USDT chart courtesy of Tradingview, we observe the following:

  • Bitcoin’s trade volume is in the green indicating buying interest in the asset as the halving approaches.
  • The current price is above the 50, 100 and 200 Daily moving averages indicating a bullish environment.
  • Using the aforementioned MAs, Bitcoin looks set to reject the earlier identified Death cross on the daily chart.
  • BTC’s daily MACD is in the green and shows continual buying interest.
  • However, the MFI indicates an overbought situation for Bitcoin and could signal a retracement before another drive up as the BTC halving approaches.

(Feature image courtesy of Aleksi Räisä on Unsplash.)

Disclaimer: This article is not meant to give financial advice. Any additional opinion herein is purely the author’s and does not represent the opinion of Ethereum World News or any of its other writers. Please carry out your own research before investing in any of the numerous cryptocurrencies available. Thank you.

ecosystem for entrepreneurs
Markethive Advertisement

Original article posted on the EthereumWorldNews.com site, by John P. Njui.

Article re-posted on Markethive by Jeffrey Sloe

Bitcoin Price Skyrockets to 8k Is this the Beginning of the Halving Bull Run?

Bitcoin Price Skyrockets to $8k, Is this the Beginning of the Halving Bull Run?

By Lorenzo Stroe – April 29, 2020

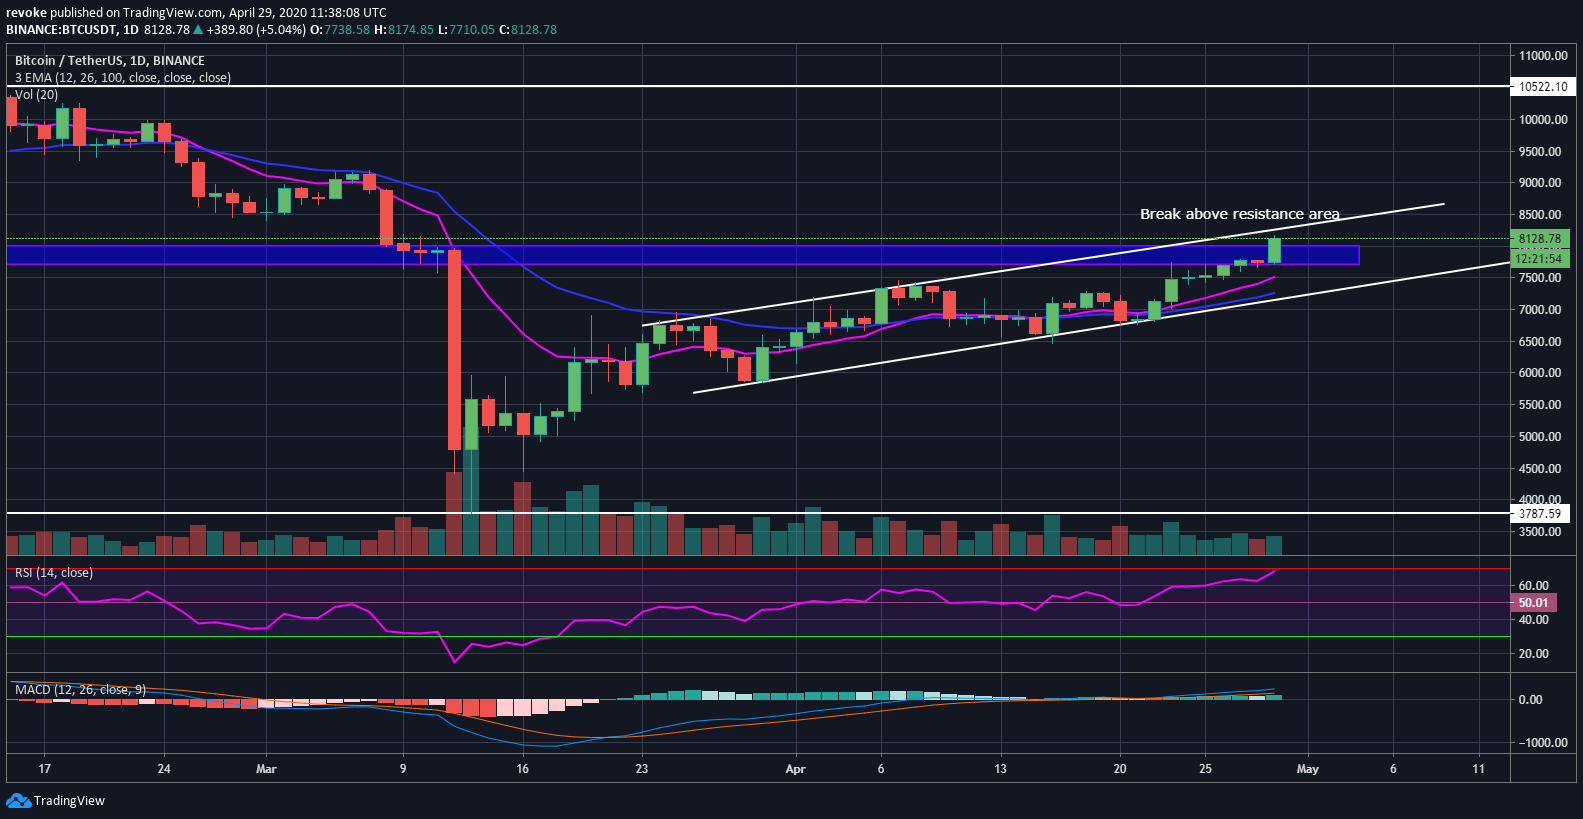
Bitcoin is currently trading at around $8,140 after a huge break above $7,792 and eventually $8,000 with a lot of continuation. The bulls have managed to break through a crucial resistance level and if they manage to close the day above $8,000, they will remain gratified.


BTCUSD Chart Via TradingView

Surprisingly, there hasn’t been a spike in trading volume but the day has just started. The bulls are now looking at basically no resistance until $9,000. The daily RSI is on the verge of a cross to the overbought zone, however, considering the momentum of the bulls, it’s unlikely that this indicator will play an important role in the near future.

Is The Halving Bull Run Finally Here?

It’s clear at this point that Bitcoin and the entire crypto market have recovered far better than the traditional stock market which is still trading sideways. Bitcoin has decoupled from the S&P500 and it’s currently trading at levels seen before the crash.


BTCUSD Chart Via TradingView

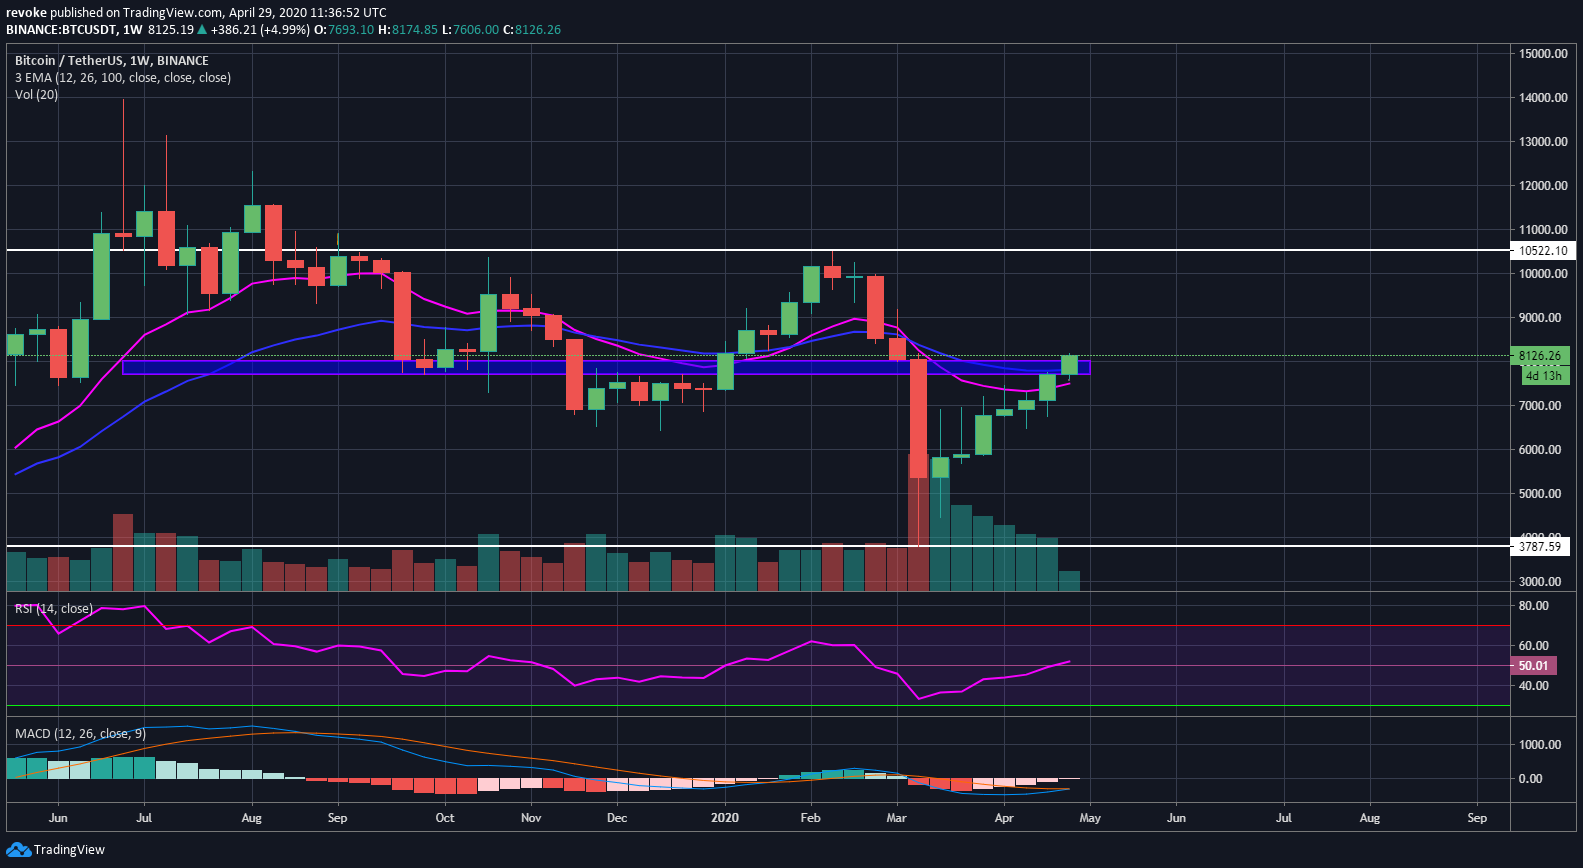
Obviously, the daily chart is in a strong uptrend but what about the longer time frames? Let’s look at the weekly chart for a moment. Clearly, the bulls are in control but have not changed the weekly downtrend just yet. At this point, we have seen 7 weeks of positive gains for Bitcoin but the bulls still need to break above $10,500 to change the trend.

The alternative is to set a lower high followed by a higher low compared to the bottom at $3,700. In the weekly chart, it is very clear how the trading volume has decreased over the past 8 weeks.

A crucial indicator here is the MACD which is on the verge of a bullish cross, the last bull cross propelled Bitcoin up to $10,500. The RSI is only at around 50 points and the EMAs are starting to look for a bull cross within the next few weeks. Bitcoin is currently trading above both the 12 and 26-period EMAs.

The monthly chart is fairly similar and definitely in favor of the bulls right now even though it is still in a downtrend. The MACD here is not a very good indicator and seems to be lagging a lot. The RSI is currently at 53 points but it’s unlikely to play an important factor until months ahead.

ecosystem for entrepreneurs
Markethive Advertisement

DISCLAIMER

The views expressed in the article are wholly those of the author and do not represent those of, nor should they be attributed to, ZyCrypto. This article is not meant to give financial advice. Please carry out your own research before investing in any of the various cryptocurrencies available.

The original article written by Lorenzo Stroe and posted on ZyCrypto.com.

Article reposted on Markethive by Jeffrey Sloe

Tyler Winklevoss: the Fed Has Set the Stage for Bitcoin BTC to Rise
Tyler Winklevoss: the Fed Has Set the Stage for Bitcoin (BTC) to Rise

Recent US Fed Reserve policies to avoid a recession might drive investors to Bitcoin (BTC).

John P. Njui   •   Ethereum News   •   April 25, 2020   •   in Bitcoin News, Cryptocurrency

In brief:

  • In a tweet earlier this week, Tyler Winklevoss believes that the Federal Reserve’s recent actions have set the stage for the rise of Bitcoin (BTC).
  • Additionally, he cautioned that the COVID19 pandemic will increase surveillance by governments attempting to track the spread of the virus.
  • He also pointed out that US Interest Rates could go into negative territory just like US Crude Oil.

In order to cushion the US economy against the economic effects of the Coronavirus, the Federal Reserve has continued to institute monetary policies that have left many economists, analysts, and crypto enthusiasts predicting that investors will flock to Bitcoin (BTC) to avoid inflation with respect to the United States Dollar.

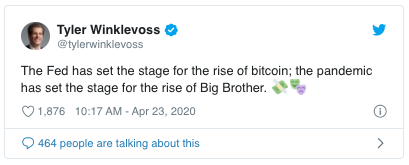
In a recent tweet, the Co-Founder and CEO of the Gemini exchange, Tyler Winklevoss, explained that the recent actions by the Federal Reserve bank to combat a Coronavirus induced recession have set the stage for the rise of Bitcoin (BTC). Additionally, he cautioned that the COVID19 pandemic will lead to more surveillance activities by governments on their citizens to monitor the spread of the disease. His tweet can be found below.

Negative Interest Rates Are On The Way

Earlier today, Mr. Winklevoss commented on the news by Bloomberg pointing at the possibility of the Fed taking US interest rates below zero. In the tweet, he compared the United States Dollar to the price of Oil that saw negative values last week. He stated:

First it was oil. Then it was…the U.S. dollar?

The Bloomberg article Mr. Winklevoss was commenting on predicts that the Fed will continue to cut interest rates to stimulate economic growth to slow down the pending recession. The Federal Reserve has already cut interest rates to a range of 0 – 0.25% and there is currently no more room to maneuver. The only option left on the table is to institute negative interest rates. According to Bloomberg, such a rate cut would not be as shocking given the current economic environment. The team at Bloomberg further elaborates on this as follows.

A decade ago, the answer would have been that it was impossible to go below zero: Banks would simply avoid the charges by withdrawing their reserve deposits and holding the funds in paper currency, which pays zero interest.

But economists now recognize that doesn’t happen, because it’s costly to store billions (or trillions) of dollars of paper currency safely. Several European central banks, as well as the Bank of Japan, have successfully taken interest rates below zero.

This stimulates consumer demand in the usual ways: by incentivizing banks to make loans at lower interest rates, to bid up the prices of financial assets, and to charge higher fees for deposits.

(Image courtesy of SpaceX on Unsplash.com)

Disclaimer: This article is not meant to give financial advice. Any additional opinion herein is purely the author’s and does not represent the opinion of Ethereum World News or any of its other writers. Please carry out your own research before investing in any of the numerous cryptocurrencies available. Thank you.


ecosystem for entrepreneurs
Markethive Advertisement

Original article posted on the EthereumWorldNews.com site, by John P. Njui.

Article re-posted on Markethive by Jeffrey Sloe