Bitcoin is Still in a No Trade Zone as BTC Battles for $9,300 Support
Bitcoin is once again attempting to maintain the crucial $9,300 support zone.

John P. Njui • BITCOIN (BTC) NEWS • June 20, 2020
In brief:
- Bitcoin has been experiencing some serious sideways movement for over a week.
- Since around the 11th of June, BTC has oscillated between $9,600 and $8,900.
- $9,300 continues to be a strong support zone as Bitcoin’s next move is torn between pumping and dumping.
Another weekend has commenced and Bitcoin is once again in the spotlight as the King of Crypto has had a very uneventful few days since last week. Around the 10th of June, Bitcoin tried and failed once again to claim $10,000.
As a result, it dropped to around $9,100 almost immediately and has since been experiencing some serious sideways movement since the 11th of June. For over a week, BTC has been oscillating between $9,600 and $8,900 providing the perfect environment for experienced scalpers but confusing swing traders who prefer bigger moves in the crypto markets.
BTC is Still in a No Trade Zone
The uncertainty of Bitcoin to either move up or down has forced many traders to sit on the sidelines as they wait for a proper signal of BTC’s next move. At the last weekly close, it was clear that BTC was going to lose the $9,300 support zone. However, a bullish stock market brought about by the Fed, the European Central Bank and the Bank of England printing more money, has further provided a case for BTC attempting $10,000 once again.
This is due to the fact that since the Coronavirus crash of mid-March, Bitcoin has proven to be highly correlated to the global stock markets.
It is with this conflict between technical analysis pointing towards a move down and the stock markets pumping, that it can be concluded that Bitcoin is in a clear no-trade-zone.
$9,300 is Once Again the Battle Ground

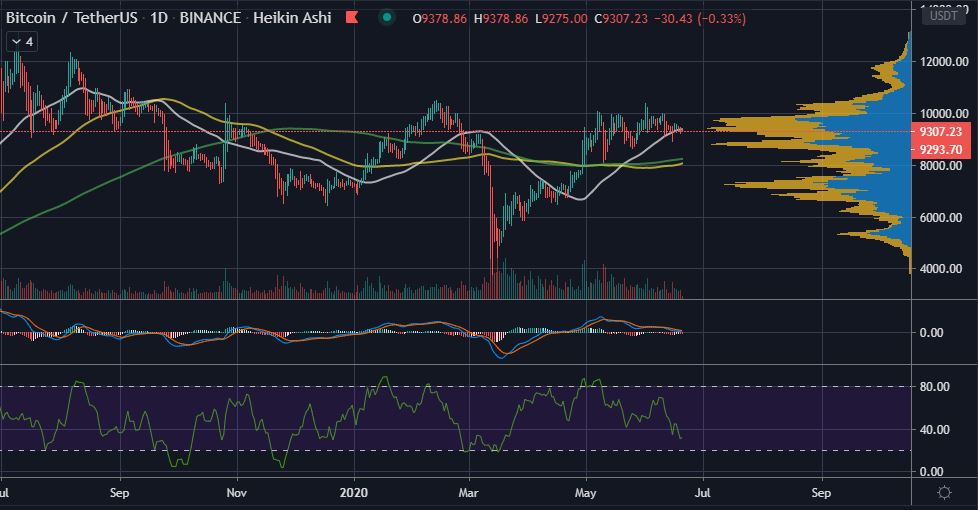
(Click on image for large view)
Checking the daily BTC/USDT chart courtesy of Tradingview, the following can be observed.
- The 50-day moving average is providing adequate support at current levels around $9,300.
- The 100-day and 200-day moving averages provide further support around the $8,000 – $8,100 range.
- The usual support zones of $9,150, $9,050 and $8,900 are still valid.
- Trade volume has reduced pointing to a major move soon.
- MACD is pointing towards a move down with the MFI slightly indicating a push up.
Conclusion: A Possible Red Week Ahead
In conclusion, Bitcoin is displaying a bag of mixed signals as to what direction its price will take in the coming week. For the swing traders, it is a clear no-trade zone with the focus once again on the weekly close on Sunday.
Also to note, is that the CME Bitcoin Futures expire next Friday, June 26th. Therefore, if history is to go by, the coming week will be a red one for BTC. Additionally, the world is now settling to the fact of a possible second wave of the Coronavirus in the United States as well as China. This reality could cause the stock market to also experience losses in the week to come.
As with all technical analyses of Bitcoin, investors and traders are requested to use risk management techniques as well as stop losses to protect their trading capital.
Original article posted on the EthereumWorldNews.com site, by John P. Njui.
Article re-posted on Markethive by Jeffrey Sloe


