Bitcoin Price Is Showing All 3 Crucial Signs of a Classic Bull Trap
Bitcoin price surged by 10 percent in 24 hours, but three factors suggest that the rally itself may be a fakeout.

Image courtesy of CoinTelegraph
The Bitcoin price increased by more than 10% in a 24-hour span, rising from $7,020 to $7,770 on both spot and futures exchanges. But, BTC is showing all three signs that the upsurge was a bull trap.
Negative futures funding rate before the rally, altcoins failing to front-run Bitcoin, and the BTC price running into a multi-year resistance level all point toward the recent price spike being a fakeout.
Futures funding rate was negative before Bitcoin rally
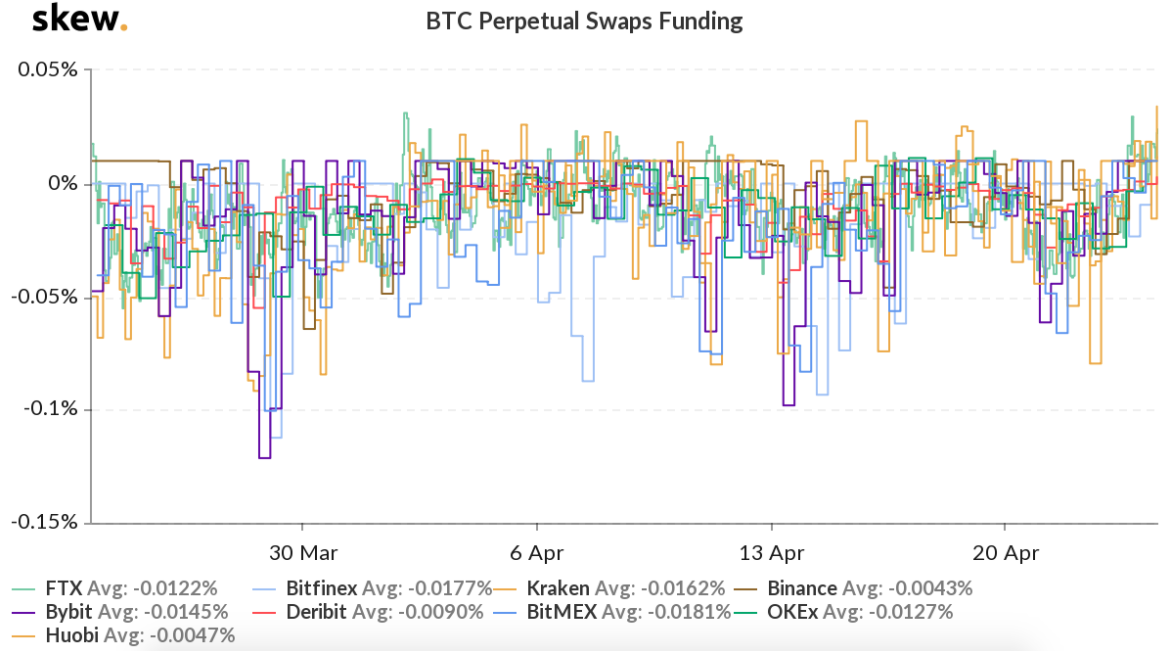
On Binance Futures, the funding rate of Bitcoin dropped to as low as -0.03% prior to the abrupt increase in price.

Bitcoin funding rate chart across all futures exchanges. Source: Skew
Futures exchanges like BitMEX and Binance Futures use a system called funding to provide balance in the market for both long and short contract holders. If there are more short contracts in the market, then the funding rate turns negative and traders shorting BTC have to compensate long contract holders with a portion of their positions.
As an example, if a trader places a $50,000 short on Bitcoin and the funding rate is -0.03%, then the trader has to pay $15 every eight hours, so $45 in total per day to long contract holders.
When the Bitcoin price started to increase and the funding rate remained negative on April 23, it created an unfavorable environment for sellers, as they were paying a part of their positions while the value of their trades was swiftly declining.
That forced short holders to close or adjust their positions, adding to the already rising buying demand in a short period of time. It ultimately converted into a short squeeze, liquidating $79 million worth of shorts on BitMEX alone.
A short squeeze was expected due to the negative funding rate, but the momentum of the rally dwindled quickly, raising skepticism towards the strength of the upside move.
Altcoins are not rallying in tandem
Typically, in an extended and sustainable Bitcoin rally, major alternative cryptocurrencies in the likes of Ether (ETH) and XRP tend to rise in tandem with BTC, front running it at times.
During the time the Bitcoin price increased by seven percent, the price of Ether rallied by around seven percent, underperforming against BTC.
The lack of high volatility in the altcoin market amidst a Bitcoin uptrend indicates that there are not many buyers in the cryptocurrency market willing to take additional risks in the short-term.
BTC finds itself at a multi-year resistance area
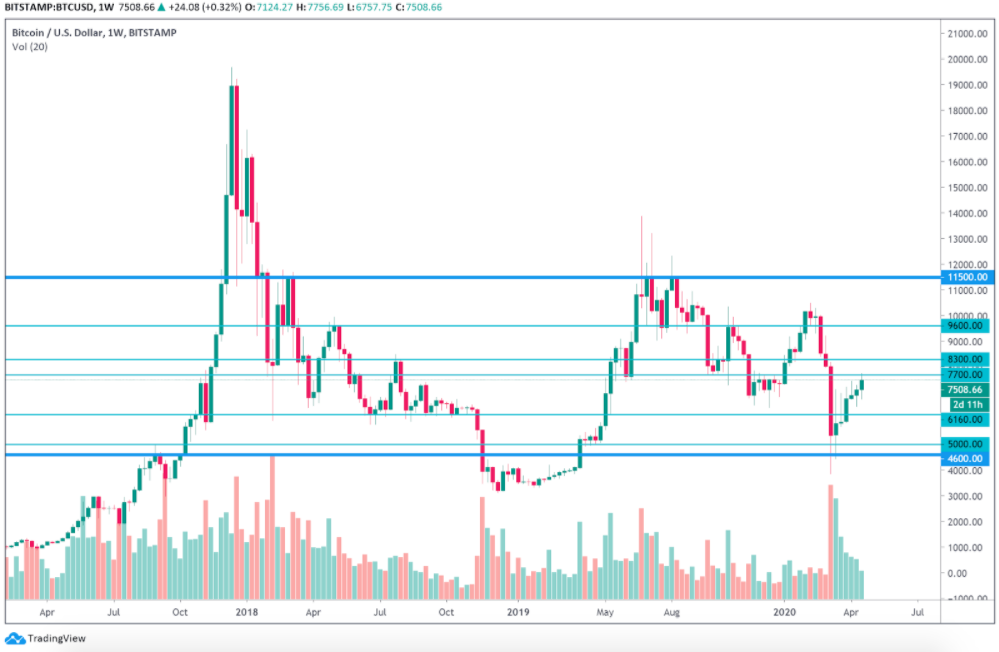
The spike in the Bitcoin price came to a halt at $7,770, a level that has acted as a resistance level since early 2018.

BTCUSD weekly chart. Source: Tradingview
The $7,700 to $8,300 range has served as one of the heaviest resistance areas alongside the $10,500 to $11,000 range since January of 2018.
With $7,900 and $8,000 being historically important simple moving average (SMA) resistance levels, it is highly improbable that BTC breaks both levels at once without any rejection, which may cause a steep downtrend following the halving in mid-May.
One variable, however, is that April through July have consistently been strong months for Bitcoin throughout the past several years and the upcoming halving falls into the three-month range.
Original article posted on the CoinTelegraph.com site, by Joseph Young.
Article re-posted on Markethive by Jeffrey Sloe


