
Bitcoin Price Fights to Hold $9.5K to Stave Off a Trend Reversal

Image courtesy of CoinTelegraph
On Feb. 20 Bitcoin (BTC) price surprisingly dropped 8.85%, a move which caught many investors off guard as up to that moment the digital asset had recovered well from the President’s Day weekend correction and was trading sideways in the $10,200 range. Citing data from CoinMetrics, ARK Invest crypto analyst Yassine Elmandjra tweeted that the $1,000 price drop was the fifth largest USD correction to occur on the hourly time frame since 2017.
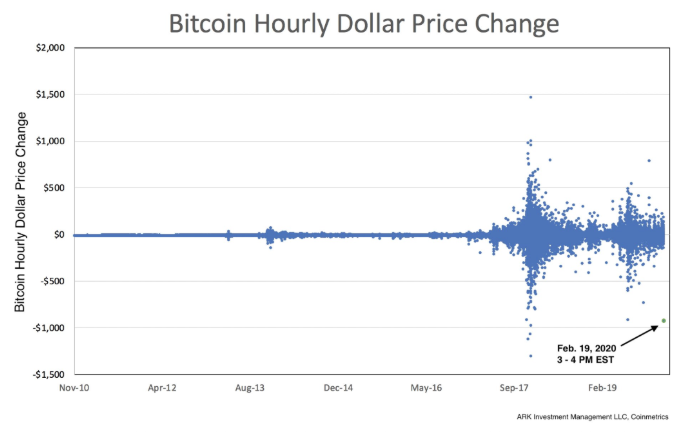
Since the sharp downside move, traders, analysts, and crypto-Twitter have been attempting to pinpoint the source of the flash crash and a handful of theories have arisen. Some have attributed the volatility to the consecutive unplanned Binance exchange outages which halted trading on the platform and prevented many traders from being able to log into their accounts.
Others, like, Cointelegraph contributor and Bitcoin trader filbfilb speculated that a shortage of Tether (USDT) at Binance could possibly have contributed to the current market conditions.
In his Telegram-based trading channel filbfilb explained that the USDT shortage possibly shows that the majority of traders were in long positions, an observation further supported by the decreasing pace of Bitcoin’s momentum and the liquidation of $120 million leveraged longs at BitMex.
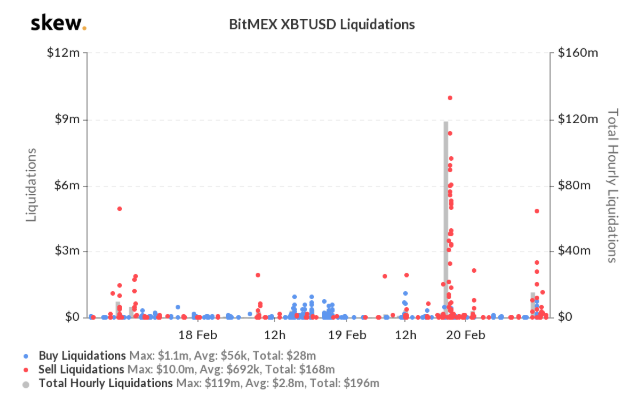
BitMEX XBTUSD Liquidations. Source: Skew.com
Regardless of the reason, the drop to $9,346 shook a lot of investors from their Bitcoin and altcoin positions and the current state of the market is negatively impacting investors’ bullish sentiment as they are choosing to wait on the sidelines for a clearer signal that a bottom has been reached.
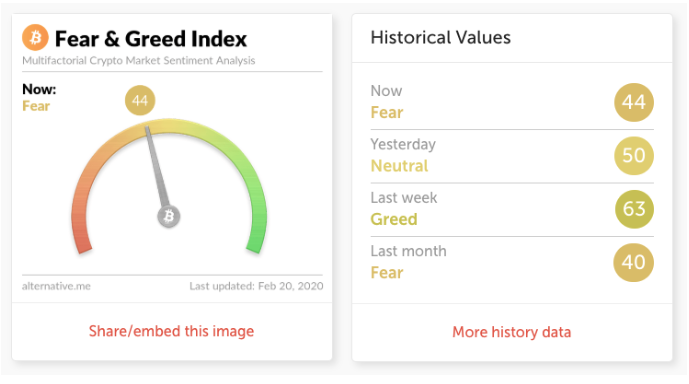
Crypto Fear & Greed Index. Source: Alternative.me
Is the current price action a buy the dip opportunity or is Bitcoin on the verge of a significant trend change? Let’s check the charts to see.
Excited traders overlooked the tweezer top
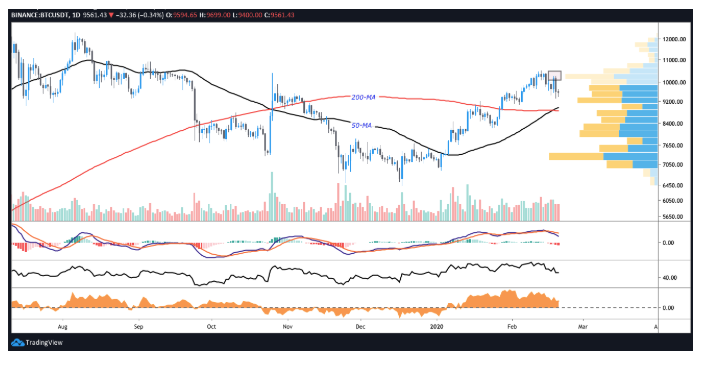
BTC USDT daily chart. Source: TradingView
As shown by the daily chart, Bitcoin formed a tweezer top candlestick pattern at $10,250 after recovering from the previous weekend’s drop to $9,450. This should have been a signal that the likelihood of a pullback could occur but traders were probably feeling bullish after Bitcoin’s quick recovery from $9,450 placed the digital asset back above key support levels.
Despite the shock caused by yesterday’s correction Bitcoin price still found support at the high volume node of the volume profile visible range (VPVR) at $9,300 to $9,438. While this is reassuring, some cautionary notes are low purchasing volume which highlights a lack of buyers interested in stepping into the current dip and the state of the two most frequently referenced oscillators by traders not yet registering oversold conditions.
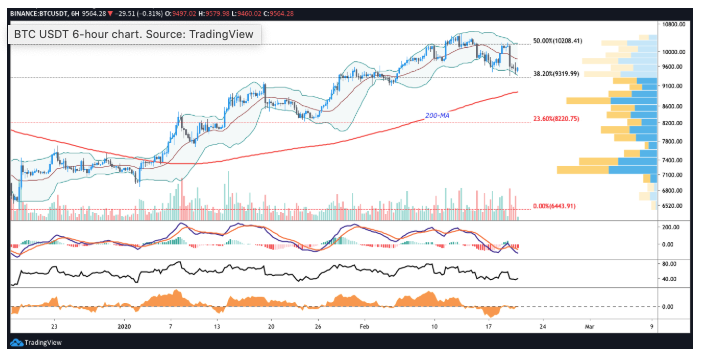
BTC USDT 6-hour chart. Source: TradingView
On the 6-hour timeframe, the relative strength index (RSI) has yet to manage an oversold bounce and the moving average convergence divergence (MACD) line continues to plummet, pressing on -100 at the time of writing.
Traders will also notice that the MACD histogram bars continue to elongate in negative territory (below 0) and the pattern of lower highs in the 6-hour chart is unbroken.
Bearish scenario
If buyers continue to believe the current price action is not a âbuy the dip’ opportunity the price could drop below the VPVR high volume node ($9,438) and the 200-day moving average at $8,800 where there is another VPVR high volume node.
The shorter timeframe shows the price slowly making higher lows but the purchasing volume is not significant enough to hold the price above $9,600. Over the short-term, bulls need to defend the $9,500 support (black arrow on chart below) as the daily and weekly timeframe shows it to be a key level. A more significant trend change could push the price lower to $8,800 to $8,400.
Bullish scenario
If we zoom out to assess Bitcoin’s price action since reaching its 2019 top at $13,800 on June 26, 2018, we can see that the 38.2% Fibonacci Retracement level has been a frequent area where the price has bounced after strong corrections.
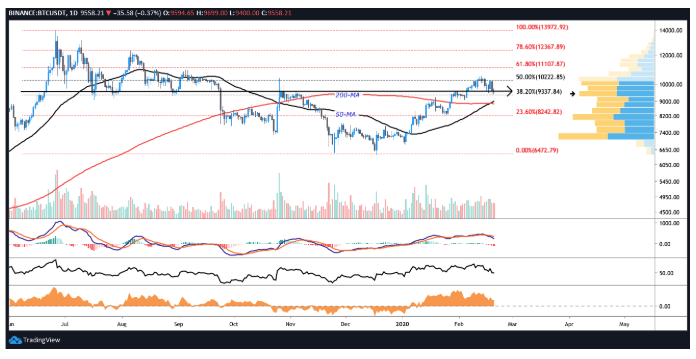
BTC USDT daily chart. Source: TradingView
Since June 26, 2018, the price has bounced here more than 10 times and yesterday’s pullback brought the price to the 38.6% level again. It’s crucial that the price stays above this level because the 38.6% Fibonacci retracement has also functioned as a strong resistance once the price dips below it.
On the flip side, assuming the price breaks out, we can also see that the last three Bitcoin rallies on October 12, 2019, February 12, 2020, and February 18, 2020, have failed to break above the 50% Fibonacci Retracement level. Thus, Bitcoin price needs to secure a few daily closes above $10,250 (50% Fibonacci retracement) before any calls for $11,000 can be seriously considered.
For the short term, Bitcoin price needs to knock out $9,630 and above this price, $9,750 is likely to function as a level of resistance. A more convincing maneuver would be to see Bitcoin price overtake the 20-MA of the Bollinger Band indicator and sustain above $9,850.
Original article posted on the CoinTelegraph.com site, by Horus Hughes.


